Reporting#
Introduction#
LiveShield Manager can generate incident reports from detected DDoS attacks. Data is taken from attack records stored in the system: detection times, applied filtering rules, blackholing routes, packet dumps, and traffic statistics.
The supported format is KSC, a Polish-language incident report used by telecom operators and other entities that need to document anti-DDoS events for regulatory purposes. Each attack is mapped to 18 predefined fields. Field names and PDF content are in Polish; the Reporting page in Manager is in English.
Note
KSC report export requires Manager 1.2.0 or newer. See Version checking for version details.
Generate report#
Go to Reporting in the main menu.
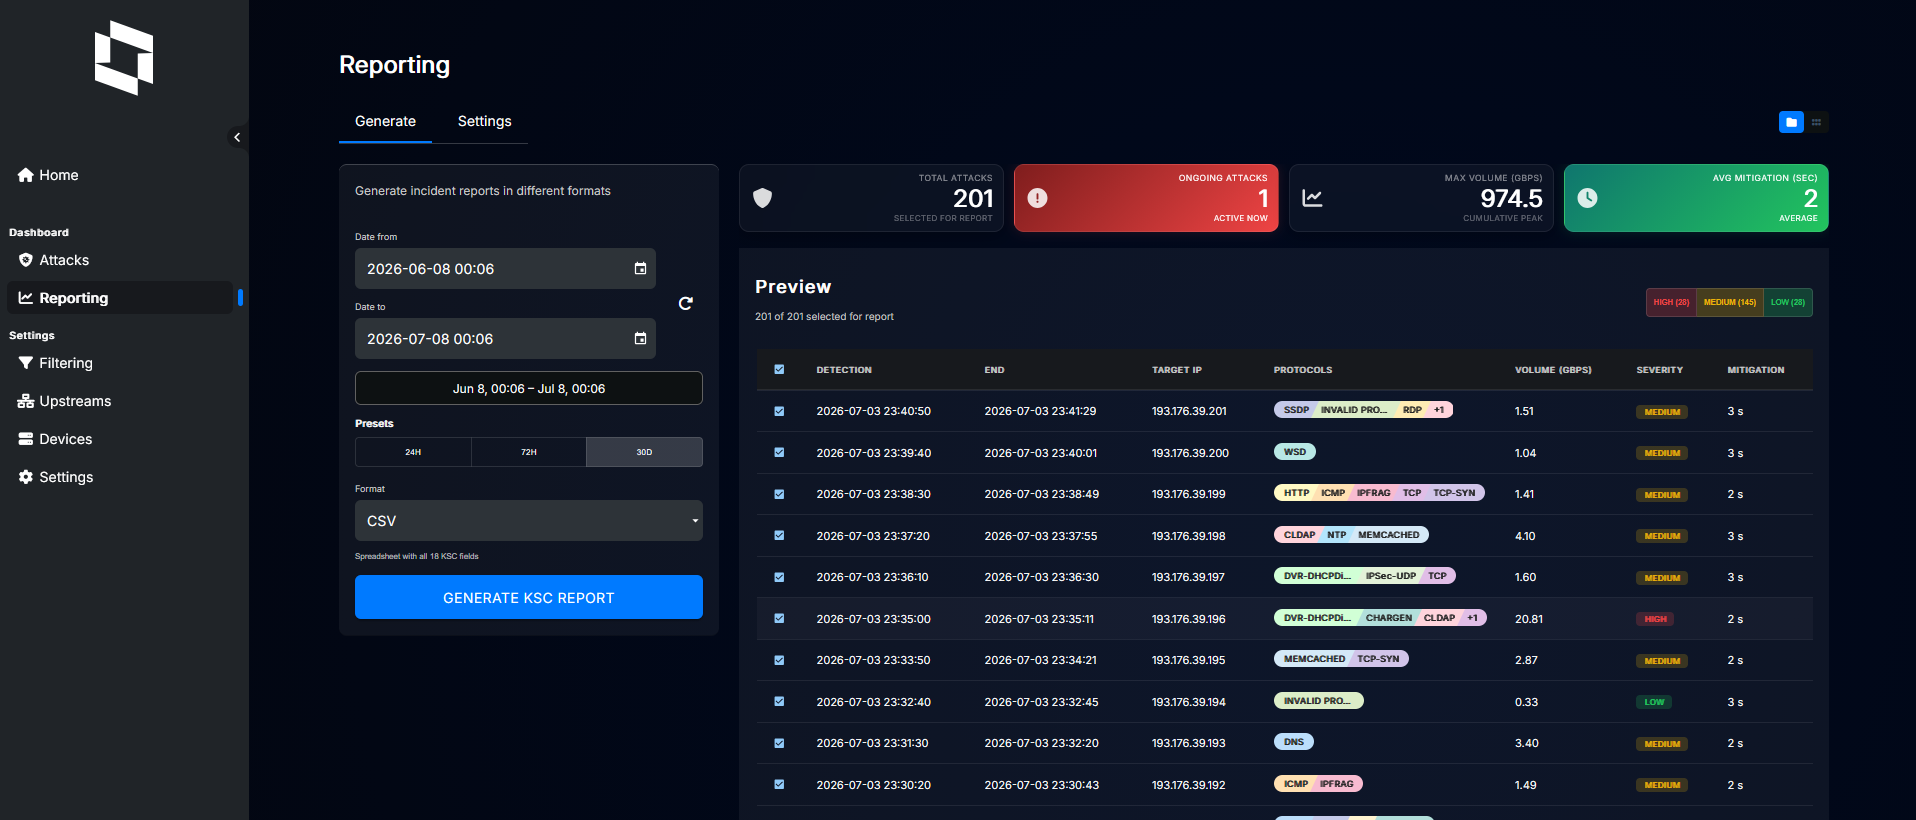
The page has two tabs: Generate and Settings. You need permission to view attacks. Only attacks you have access to will appear in the preview and export.
The Generate tab opens by default with the last 24 hours pre-selected.
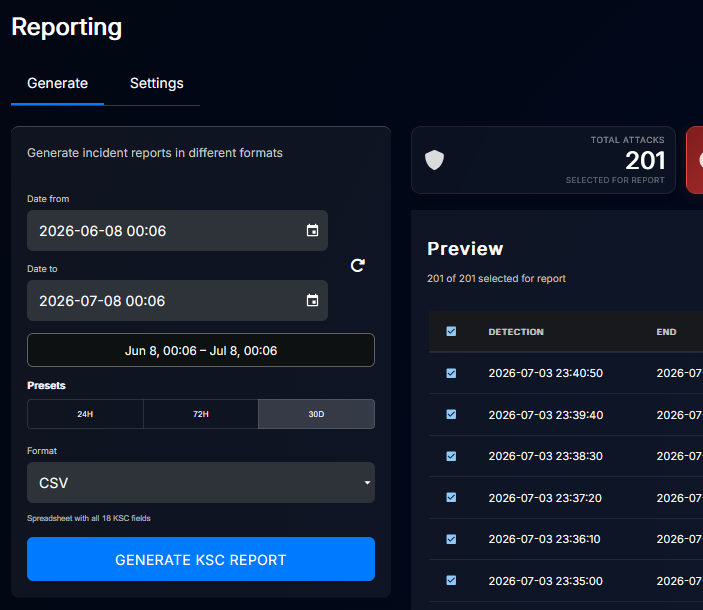
Set Date from and Date to, or use a preset (24h, 72h, 30d). The attack preview loads automatically when you change the date range. You can also click the refresh button to reload it manually.
All attacks shown in the preview are selected by default. Deselect any you don’t want in the report, then choose CSV or PDF and click Generate KSC report. The browser downloads ksc_report_{timestamp}.csv or ksc_report_{timestamp}.pdf.
Settings explained:
Date from / Date to: Datetime range for attacks to include. An attack is shown if it overlaps the range, i.e. it started before the range ends and either ended after the range starts or is still ongoing.
Presets: Shortcuts for last 24 hours, 72 hours, or 30 days.
Format: CSV exports a spreadsheet with all 18 KSC fields. PDF exports a summary with charts and a detailed incident table.
Generate KSC report: Exports selected attacks only. The button is disabled while loading, when Date from is not earlier than Date to, or when nothing is selected.
Hint
Summary stats in the preview panel count selected attacks only. Deselecting attacks updates the numbers.
Preview#
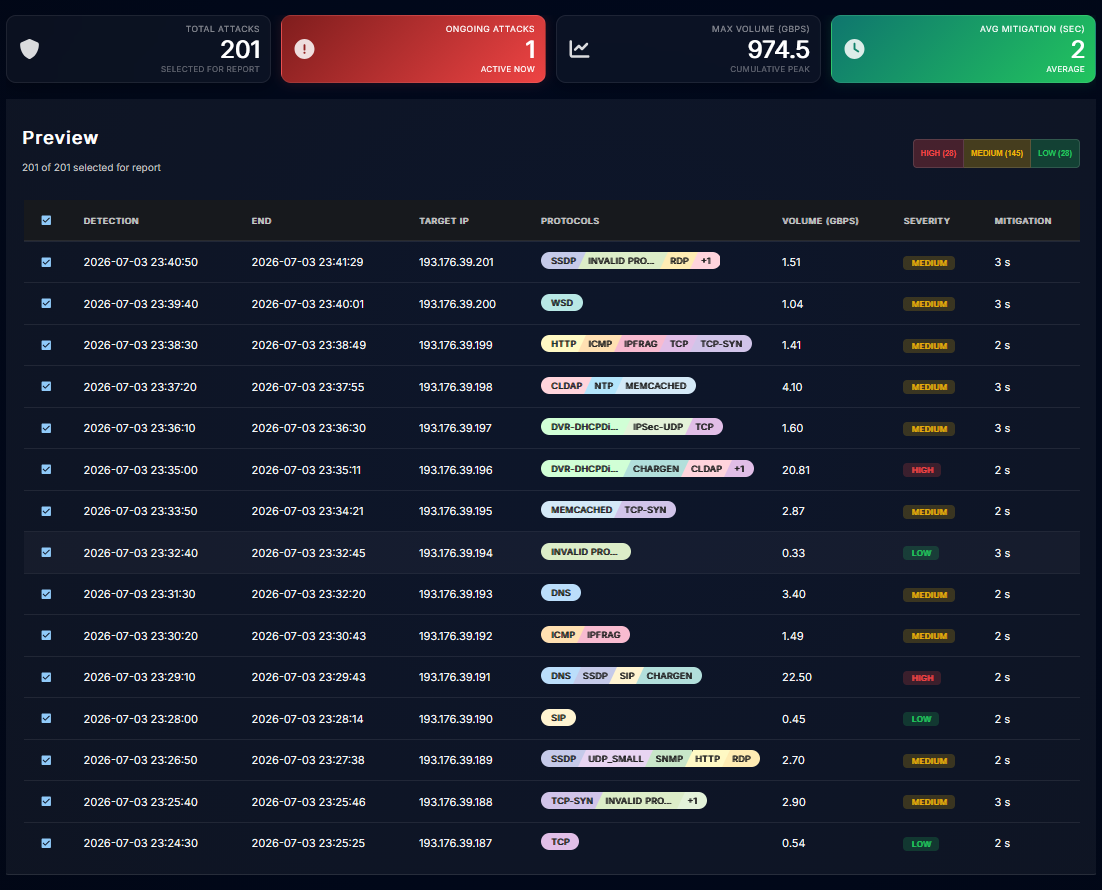
Above the table you will see:
Total attacks - how many are selected for the report
Ongoing attacks - how many are still active
Max volume (Gbps) - peak volume across the selection
Avg mitigation (sec) - average time from detection to the first filtering rule (N/A if not applicable)
The table shows: Detection, End, Target IP, Protocols, Volume (Gbps), Severity, and Mitigation. Ongoing attacks are marked as Ongoing in the End column.
Use checkboxes to select individual attacks, select all, or toggle by severity with the High, Medium, and Low buttons above the table.
KSC export#
CSV
All 18 KSC fields for each selected attack, with Polish column headers. Use this when you need the full dataset for spreadsheets, archival, or submission to authorities.
A formatted report titled “KSC - Raport incydentów”. The first pages contain a summary dashboard: incident count, attack frequency, volume and mitigation stats, carpet bomb and blackholing usage, severity breakdown, and charts (volume distribution, timeline, protocols). Following pages contain Szczegółowa tabela incydentów, a landscape table with all 18 columns.
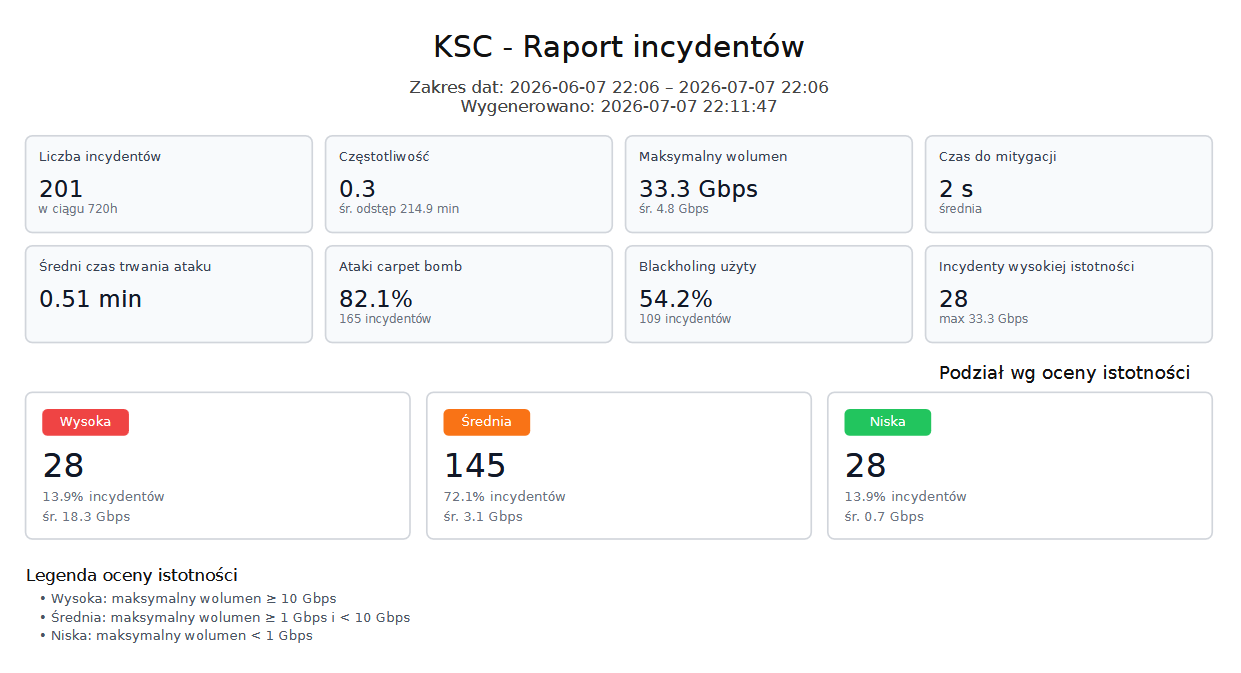
Footer text: “Wygenerowano w systemie anty-DDoS - LiveShield”.
KSC fields#
Each incident row contains these fields (Polish names as exported):
Timestamp wykrycia ataku: Attack detection time.
Timestamp pierwszego pakietu ataku: Time of the first attack packet.
Timestamp pierwszej reguly filtrowania: Time when the first filtering rule was applied.
Timestamp zakonczenia ataku: Attack end time, or Ongoing.
Czas trwania ataku [min]: Attack duration in minutes.
Czas do mitygacji [sek]: Seconds from detection to the first filtering rule.
Maksymalny wolumen [Gbps]: Peak volume in Gbps.
Maksymalne PPS: Peak packets per second.
Wektor ataku / protokol: Attack vector and protocol.
Docelowe IP / prefiksy (cele): Target IP or prefix.
Zrodlowe IP (sample / top-N): Source IPs from filter rules.
Docelowe porty: Destination ports from filter rules.
Reguly BGP Blackholing: Blackholing rules applied. See Blackholing.
Reguly BGP FlowSpec: FlowSpec rules applied. See Detection and filtering.
Traffic dumps / pliki pcap: PCAP filenames. PCAP capture is configured per prefix in filtering settings.
Statystyki ruchu per-minuta (seria): Per-minute traffic stats (JSON, max PPS per minute).
Carpet bomb detection flag: Yes / No - set when a subnet-level attack is detected.
Severity / ocena istotnosci: High, Medium, or Low - based on peak volume and configured thresholds (see below).
Severity thresholds#
Severity is calculated from the attack’s peak volume:
High - volume ≥ High threshold (default 10 Gbps)
Medium - volume ≥ Medium threshold but below High (default 1 Gbps)
Low - volume below Medium threshold
Thresholds are used in the preview table, CSV export, and PDF summary. They also appear in the PDF severity legend.
Go to the Settings tab to change them.
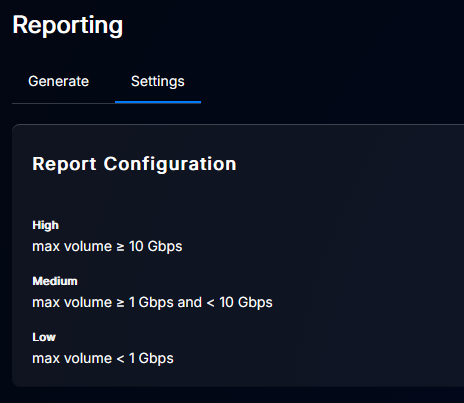
Click the edit button (pen icon) next to Report Configuration.
Settings explained:
High severity threshold (Gbps): Minimum peak volume for High. Must be greater than the Medium threshold.
Medium severity threshold (Gbps): Minimum peak volume for Medium. Must be less than the High threshold.
Hint
Low is assigned automatically when volume is below the Medium threshold. There is no separate Low threshold field.
Changes apply immediately to new previews and exports.