Base configuration#
Introduction#
This article covers the base configuration steps required to finalize the LiveShield setup after installation. It’s based on the examples provided in the Installation section of the documentation, so if you’re not familiar with that, please refer to it first.
Manager#
In order to configure LiveShield, you need to access the Manager web interface. Open your web browser and navigate to the Manager’s IP address or hostname. If you followed the installation guide, it should be accessible at https://<Manager_IP_Address>.
Manager_IP_Address is the IP address of server where you installed LiveShield Manager module.

The initial username is admin and the password is generated during installation in the installation, manager password section.
After a successful login, you should see the Manager dashboard. Changing the default password is strongly recommended.
Analyser#
After logging into the Manager, navigate to the Settings section from the main menu and then to the Analyser tab.
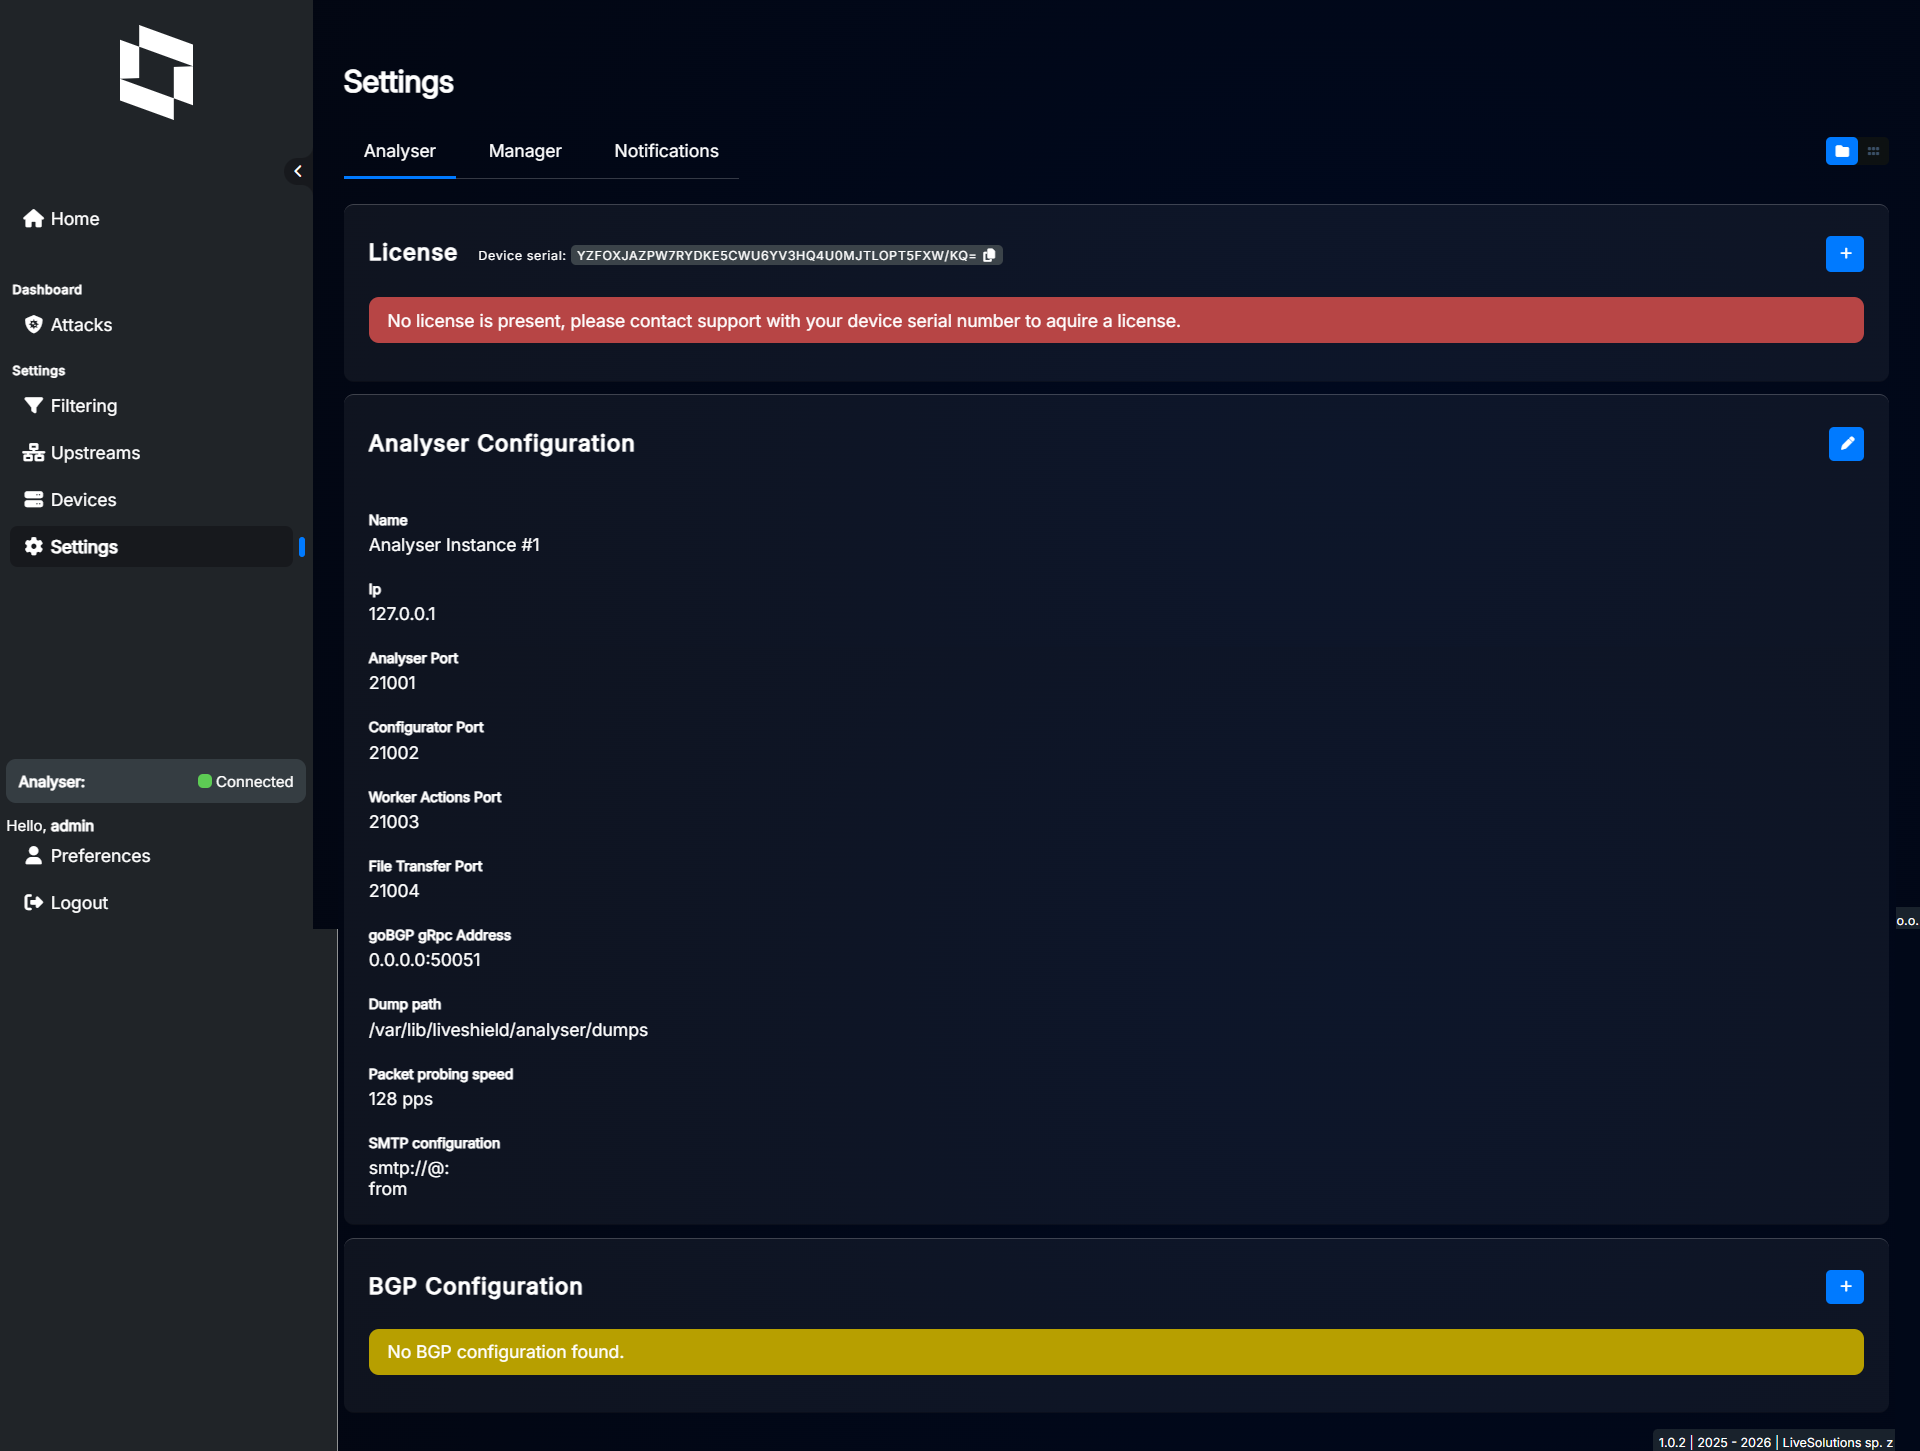
Before you start, please upload the license file if you haven’t done it yet. Refer to the Licensing section for detailed instructions.
Settings explained:
Name: A friendly name for your Analyser instance. Just for your reference.
Ip: IP address where Analyser module is reachable. If it’s running on the same server as Manager, you should use 127.0.0.1.
Analyser Port: Port number on which Analyser listens for incoming connections from workers. Used for traffic aggregation data exchange. Default is 21001.
Configurator Port: Port number for worker configuration communication. Default is 21002.
Worker Actions Port: Port number for worker module programmability communication. Default is 21003.
File Transfer Port: Port number for file transfer operations between analyser and manager modules. Default is 21004.
goBGP gRpc Address: Port number for gRPC communication with goBGP daemon, used only if BGP is configured. Default is “0.0.0.0:50051” which means “run GoBGP daemon by analyser on port 50051”. If you want to use your own goBGP, set it to “127.0.0.1” or some other IP.
Dump path: Path where analyser will store packet dumps. Default is “/var/lib/liveshield/analyser/dumps”. If you change it, please make sure that the user “liveshield” has write permissions to that folder.
Packet probing speed: This is used only when an attack is detected. It defines how many packets per second will be sent to analyser for further analysis. It can be any value in the 16-128 range. Default is 128. Higher means better analysis, faster and more accurate packet dumps but higher CPU usage.
SMTP configuration: If you want LiveShield to send email notifications, you need to provide SMTP server details here.
Worker#
After configuring the Analyser, it’s time to set up the Worker module. Navigate to the “Devices” section from the main menu and then to the “Workers” tab.
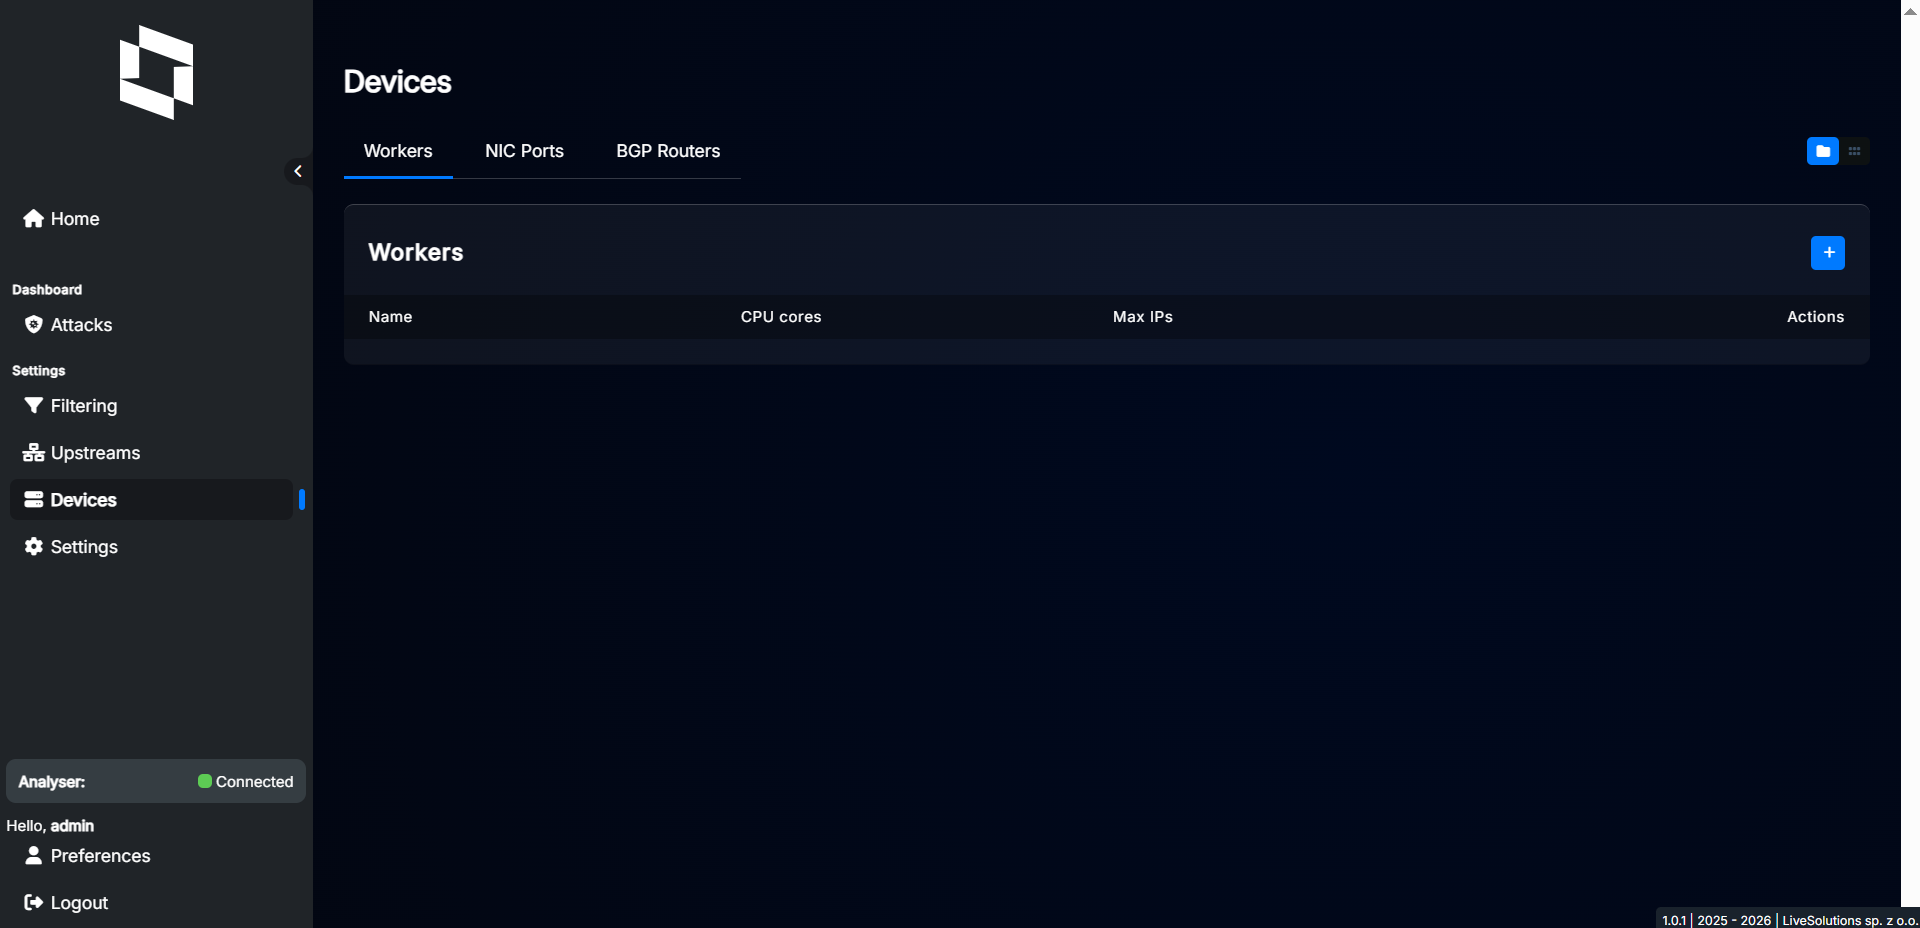
Click “+” button to add a new Worker.
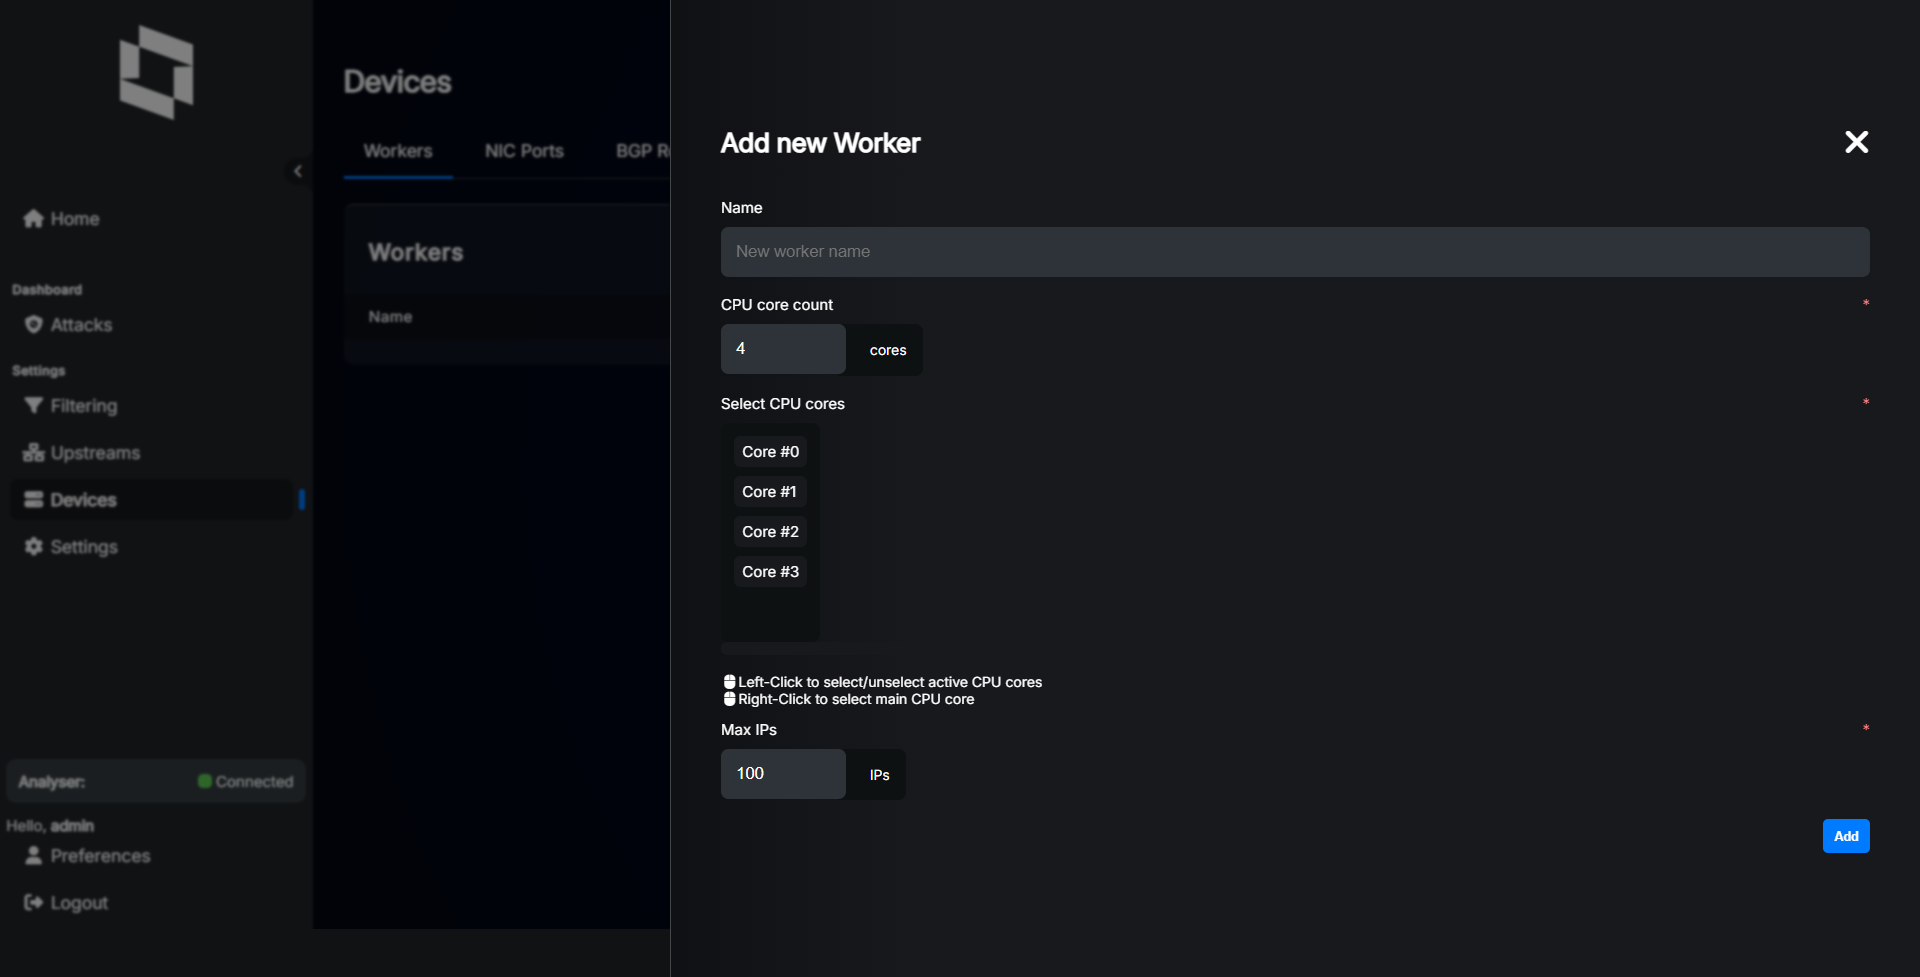
Settings explained: - Name: The name of the Worker module. This should match the name you provided during installation in the installation, worker name section.
CPU core count: Total number of CPU cores (logical threads) in the system where Worker is installed (both CPU).
Select CPU cores: Cores selection dialog to be used by this worker. Right click selects main core, left click selects cores for NICs.
Max IPs: Maximum number of active IP addresses that this worker can handle. We recommend at least 10000 IPs for production systems, depends on your network size and how many IPs have active traffic at the same time.
Below you’ll find example of properly added worker which was installed in the Installation section.
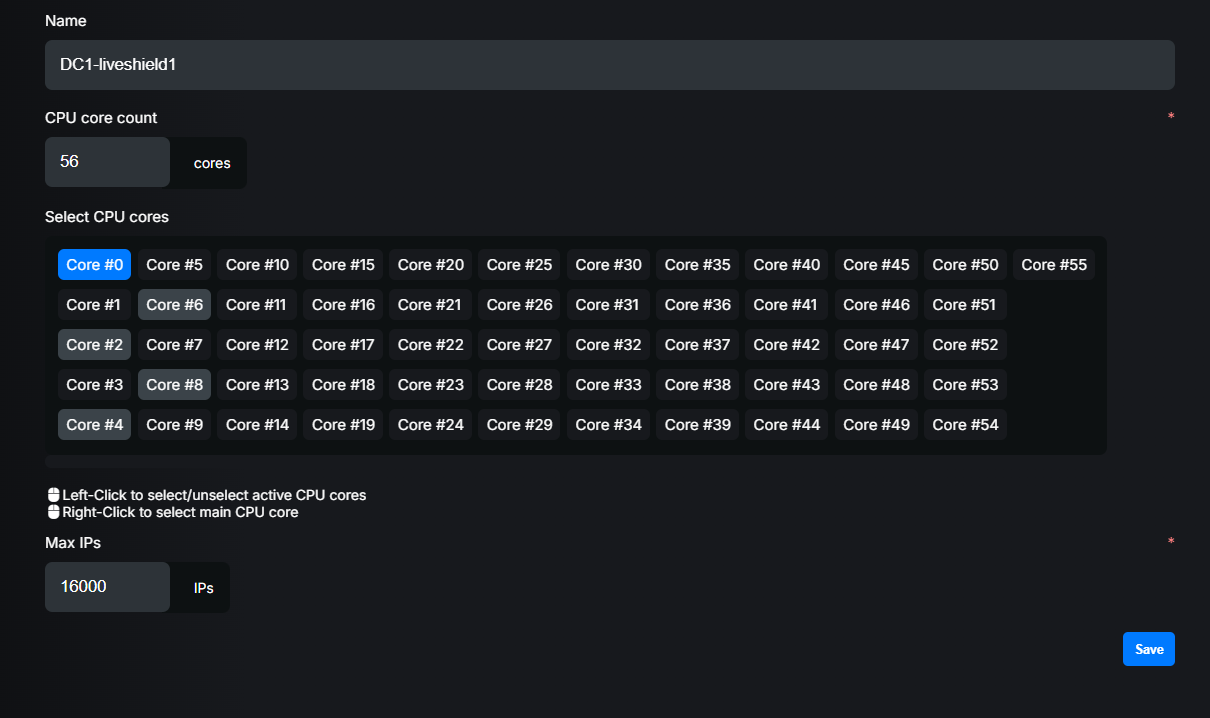
Worker name was set to “DC1-liveshield1” and this name must match the one provided during worker installation. Because our test server had 2 cpu, each 14 cores HT (28 logical threads), we set CPU core count to 56. Then we selected cores which we reserved during installation. So in this case, we “right-clicked” core 0 (main core) and “left-clicked” cores 2,4,6,8.
We set Max IPs to 16000 as this represents the maximum number of active IPs in our test network.
In the next step, you have to configure NIC ports for this worker. Each NIC port is a physical network interface. So if you have dual-port NIC and want to use both ports, you have to add two NIC ports. Click “Devices” in the menu, then select “NIC Ports” tab.
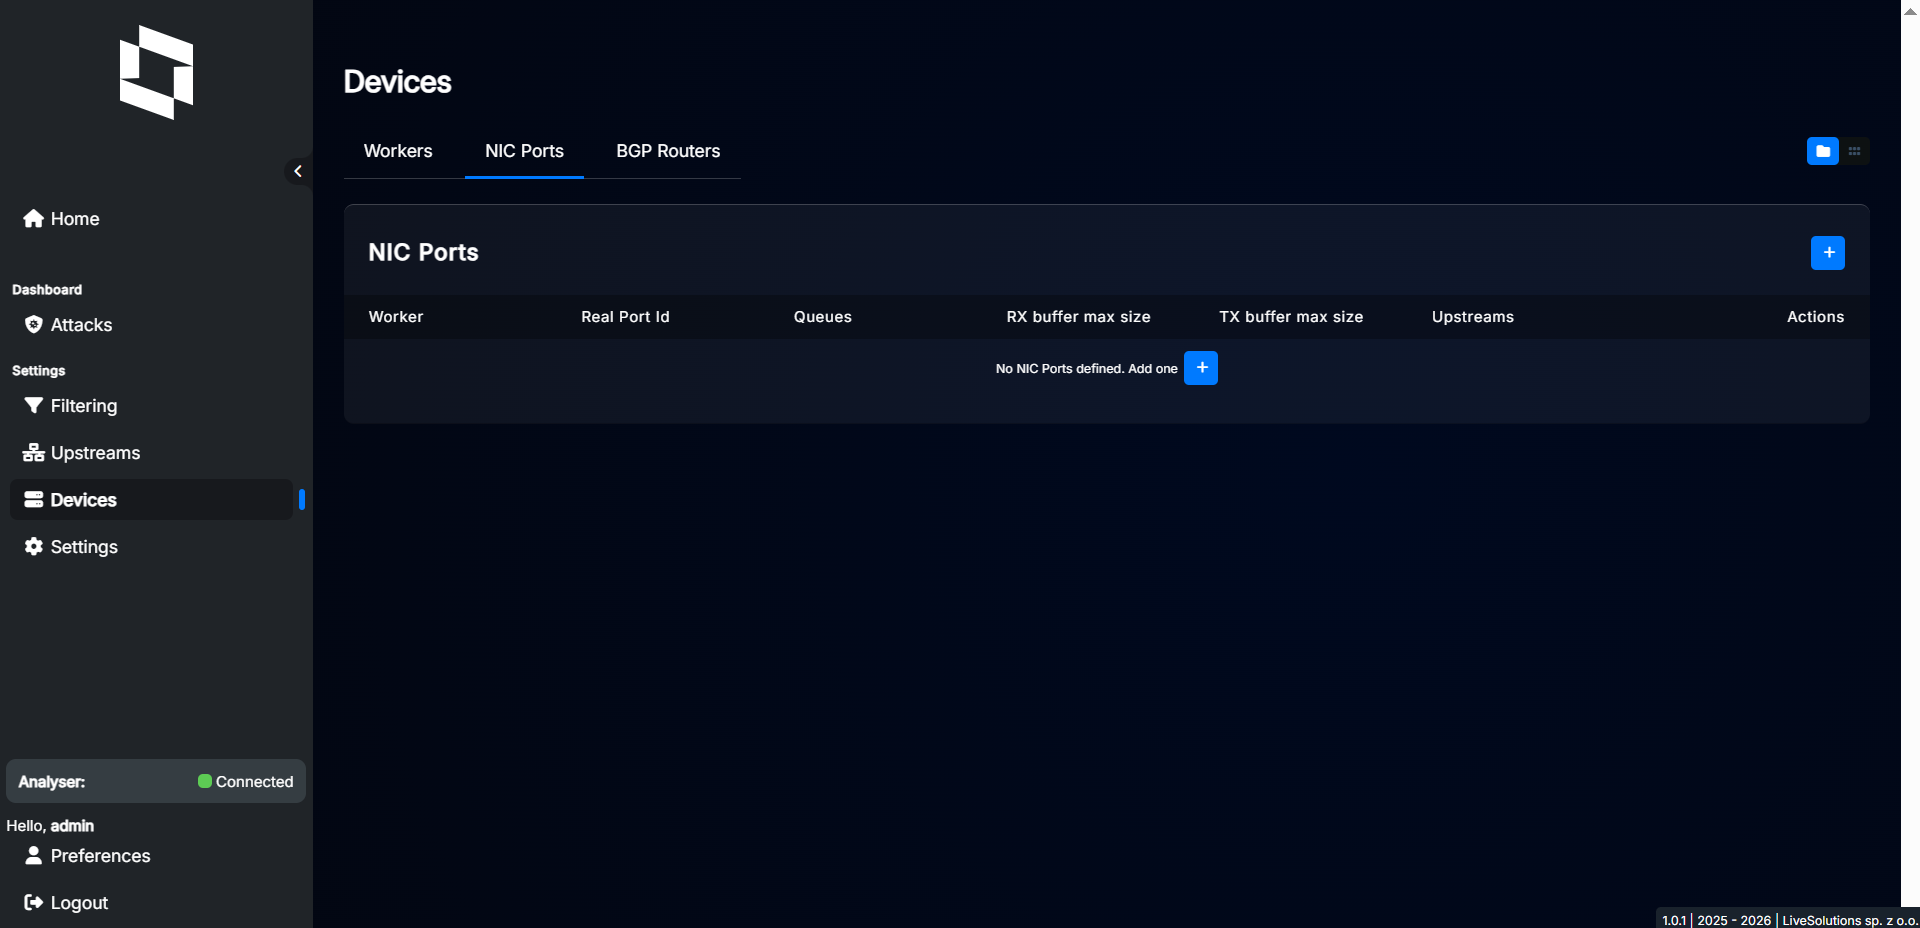
Click “+” button to add new NIC port.
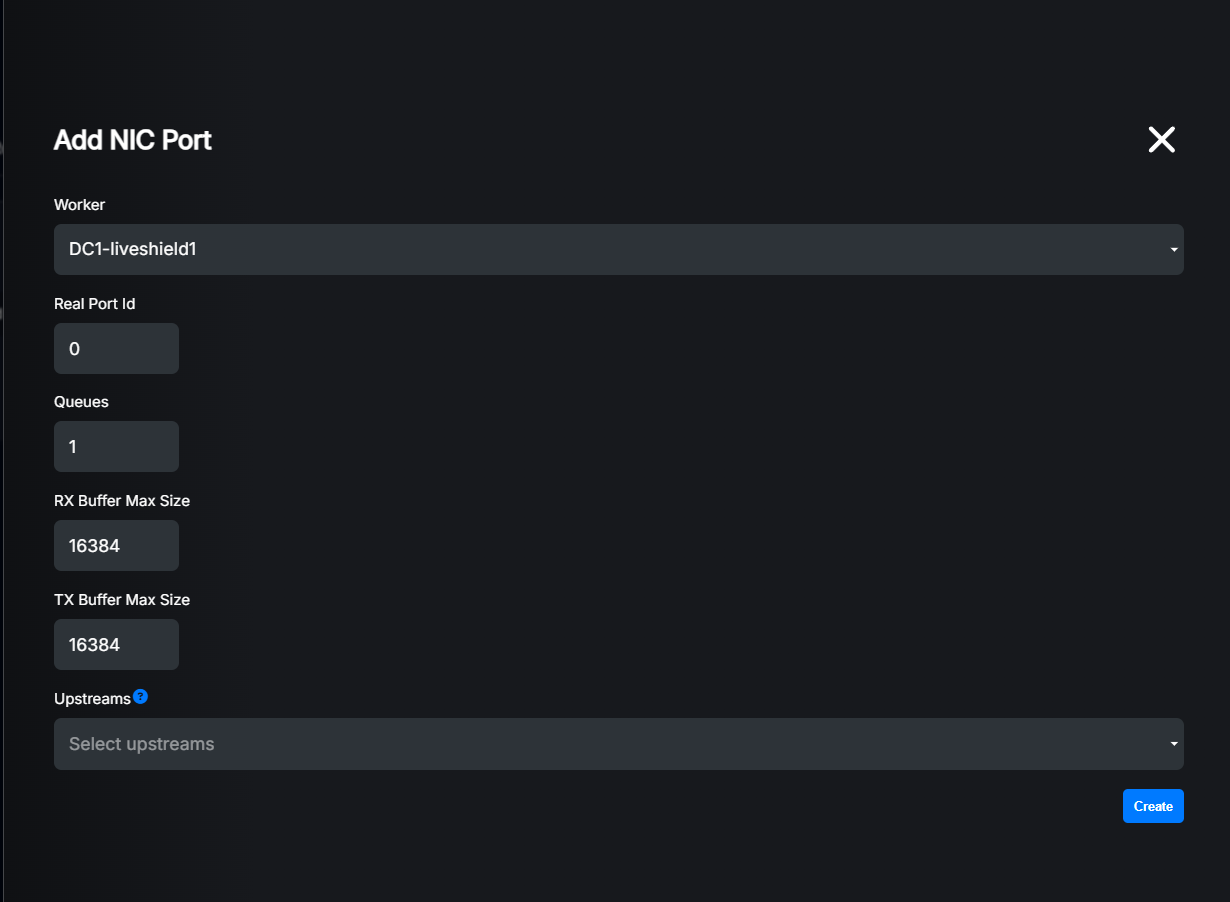
Settings explained: - Worker: Select the worker to which this NIC port belongs.
Real Port Id: The physical port ID, sorted by PCI bus order (starts from 0). Described during installation. If you have configured two ports of one NIC, first “real port id” will be 0, second 1. If you have multiple NICs, the order will be as described during installation.
Queues: Number of RSS queues configured for this NIC port. Each queue requires one CPU core, so make sure you have enough cores selected for the worker, otherwise it will fail. Please remember that increasing number too high may lead to performance degradation due to CPU cache misses and context switches. General recommendation is to set 1 queue per 10Gbps of traffic, but it can be less for some high speed NICs. You should have at least 1 queue.
RX Buffer Max Size: Size of receive ring buffer. Default is 16384. In reality, if the maximum value supported by hardware is lower than entered here, it’ll be set to maximum supported value. In most cases you probably don’t need to change it. Higher value means less chances of packet drops but in some cases with many queues, lowering this value may help to reduce cache misses and therefore improve performance.
TX Buffer Max Size: Size of transmit ring buffer. Default is 16384. In reality, if the maximum value supported by hardware is lower than entered here, it’ll be set to maximum supported value. In most cases you probably don’t need to change it. Higher value means less chances of packet drops but in some cases with many queues, lowering this value may help to reduce cache misses and therefore improve performance. This setting has no effect at this moment as worker module doesn’t generate any traffic.
Upstreams: Select upstream operators which traffic will be retrieved on this NIC port. If you are not able to selectively mirror traffic and want to filter anything except specific upstreams (vlans) inside worker, then you can define here which traffic will be retrieved on that port. If no upstreams are selected, all traffic will be retrieved which is the recommended setting in most cases (also the default).
So in our test scenario, we have single-port 40G NIC and we decided to use 4 cores (queues) for it. We just have to put “4” in queue count. We’ll leave other settings unchanged.
Apply changes and check#
Most of the settings which are impacting other modules needs to be applied by clicking “Apply” button.
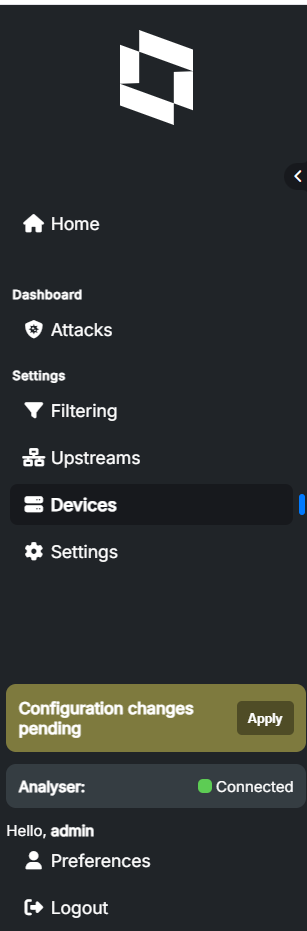
Some of the changes will generate soft reload, others will do full restart of the modules. Because during base configuration you are changing important settings, all modules will be restarted when you click “Apply”.
After applying changes, check the “Status” section from the “Home” menu.

As you can see, both analyser and worker are running. You can see green dots indicating correct communication between modules and there is some traffic retrieved from the NIC.

Analyser status above and worker status below.

You can also check status and start/stop/restart the modules from the command line (run as root or use sudo):
Check status:
systemctl status liveshield-analyser
systemctl status liveshield-worker
systemctl status liveshield-manager
Restart:
systemctl restart liveshield-analyser
systemctl restart liveshield-worker
systemctl restart liveshield-manager