Dashboard#
Introduction#
The Home page shows the current state of LiveShield and recent attacks. Starting with Manager 1.3.0, it has two tabs: Overview for day-to-day monitoring and Executive for attack summaries over a selected period.
Complete Base configuration first. For component compatibility messages, see Version checking.
Manager remembers your last selected tab in your browser. The Executive date range is included in the page URL, so you can bookmark a particular view.
Access and visibility#
Administrator: Can use both tabs, including infrastructure, licence, and platform health information.
SuperOperator: Can use both tabs and see attacks across all prefixes. Licence information and the Executive platform health section are not shown.
Operator and Viewer: See a simplified Overview with the last attack and latest attacks for their assigned prefixes. Infrastructure counters, traffic charts, and the infrastructure sidebar are hidden. The Executive tab is locked.
Assigning extra rule creation or deletion permissions does not unlock the Executive tab. See Account management for role and resource access settings.
Overview#
Open Home > Overview to inspect current traffic and recent attacks. Administrators and SuperOperators also see infrastructure counters, traffic charts, Worker status, and BGP sessions. Administrators can check licence usage here.
Click an attack to open its details. The close control remains visible while you scroll. Using the mouse wheel over an attack chart scrolls the page instead of zooming the chart.
The dashboard explains when statistics are unavailable:
Waiting for analyser connection: Manager is waiting for Analyser to reconnect. Check the Analyser service and connection settings.
No workers online: Traffic statistics will appear when a Worker comes online. Check Worker services and connectivity to Analyser.
An empty latest-attacks list means there are no attacks available to your account. For scoped users, check resource assignments before assuming that no attacks have occurred.
Connection state and version compatibility are separate checks. An Analyser can be connected but too old to exchange statistics or receive configuration. Follow the Update required message when one is shown.
Executive#
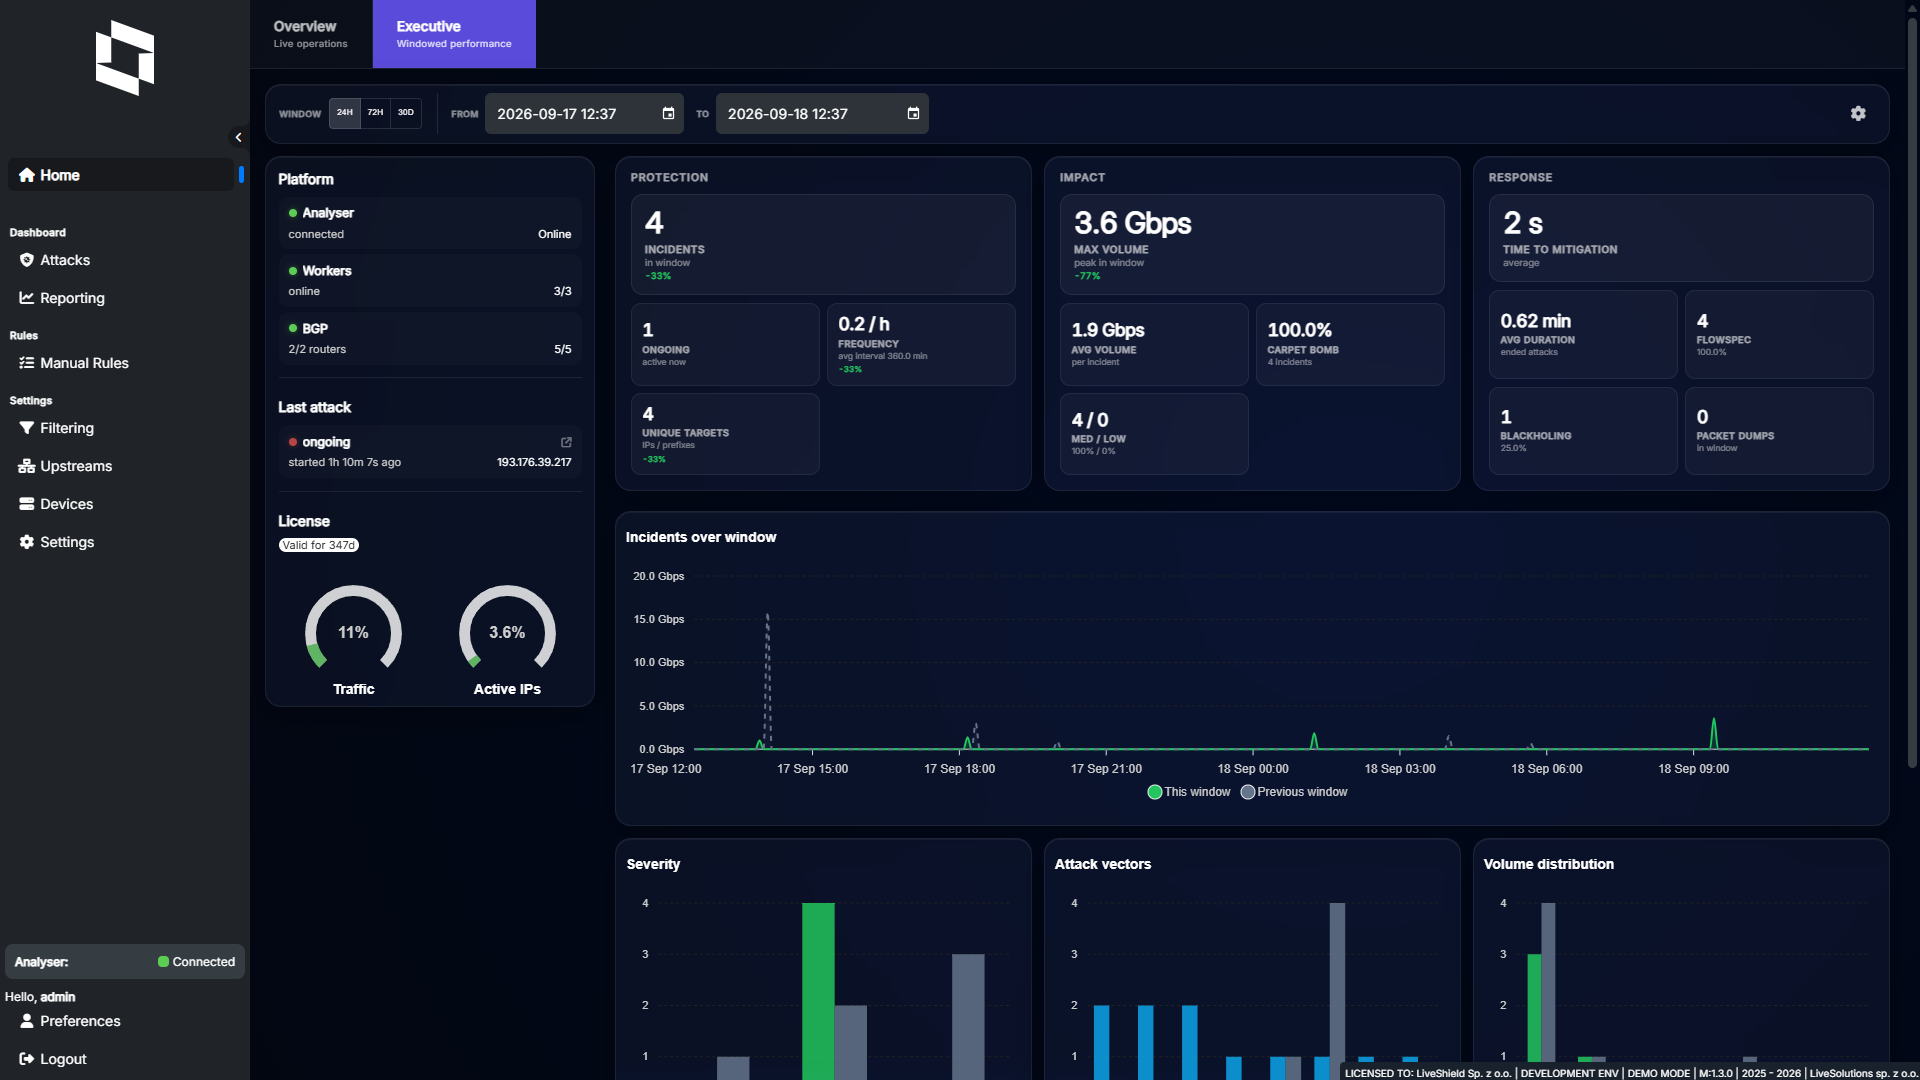
Open Home > Executive to review attack activity over a selected time window.
Select a Window preset. The defaults are 24h, 72h, and 30d.
Alternatively, set From and To to choose a custom period. The end must not be earlier than the start.
The summary reloads when you change the period. Review the indicators, charts, and Most targeted prefixes list together.
Manager compares the selected window with the immediately preceding window of the same length. For example, a 24-hour window is compared with the 24 hours directly before it. An attack that overlaps both windows can contribute to both summaries.
Note
Ongoing counts attacks active now, independently of the selected historical window. Last attack also refers to the latest available attack, rather than only attacks in that window.
Reading the indicators#
Protection: Incident count, ongoing attacks, attack frequency per hour, and unique targeted IPs or prefixes. Trend indicators compare supported metrics with the previous window.
Impact: Maximum and average recorded peak attack volume, carpet bomb incidents, and severity counts. Volume is shown as a traffic rate in Gbps, not transferred data in GB.
Response: Average time to mitigation, average completed-attack duration, counts of incidents with FlowSpec or blackholing, and packet dumps. An incident can use both FlowSpec and blackholing, so these counts are not mutually exclusive.
The summaries use attacks overlapping the selected period and their recorded attack metrics. They are not a fresh traffic measurement limited to the exact window boundaries. Missing measurements are shown as unavailable where applicable.
Charts and targeted prefixes#
Incidents over window: Shows attack activity across the selected period, with the previous period for comparison.
Severity: Groups incidents into High, Medium, and Low using your Executive severity settings.
Attack vectors: Shows recorded attack protocols. One incident can contain more than one protocol.
Volume distribution: Groups incidents by recorded peak traffic rate.
Most targeted prefixes: Shows incident counts, change from the previous period, peak volume, and unique hosts for affected prefixes.
Administrators also see platform health indicators for Analyser, Workers, BGP, and the licence. These describe current platform state, even when you select a historical period.
Executive settings#
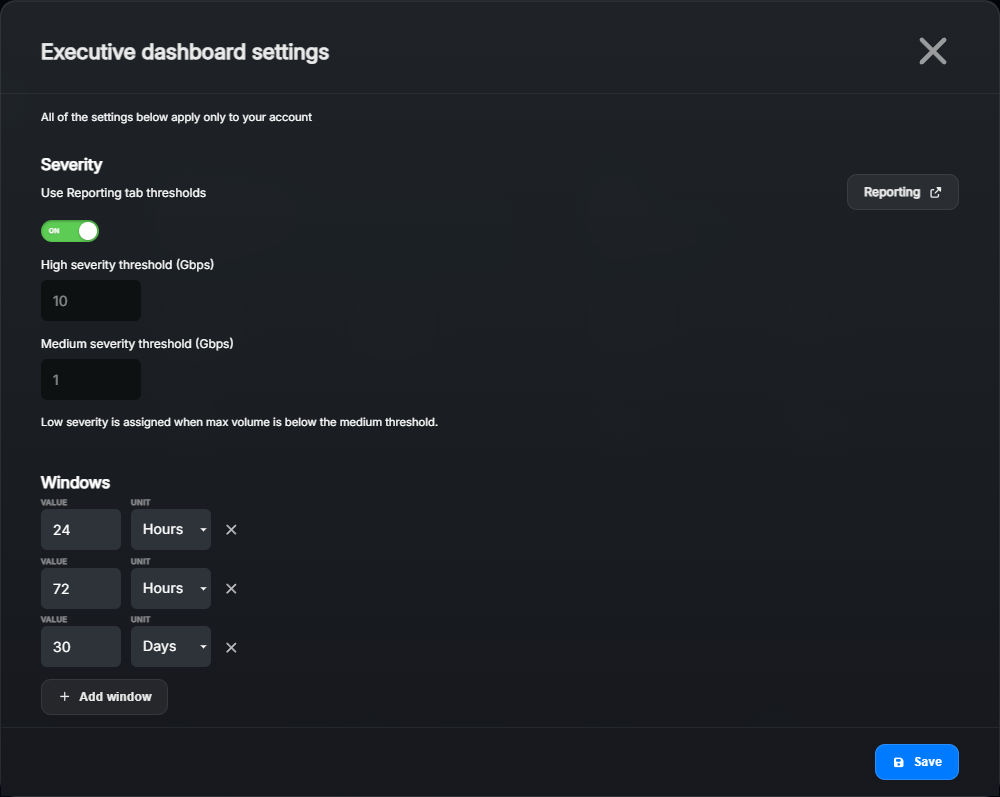
Click the cog button labelled Executive dashboard settings on the Executive toolbar.
Settings explained:
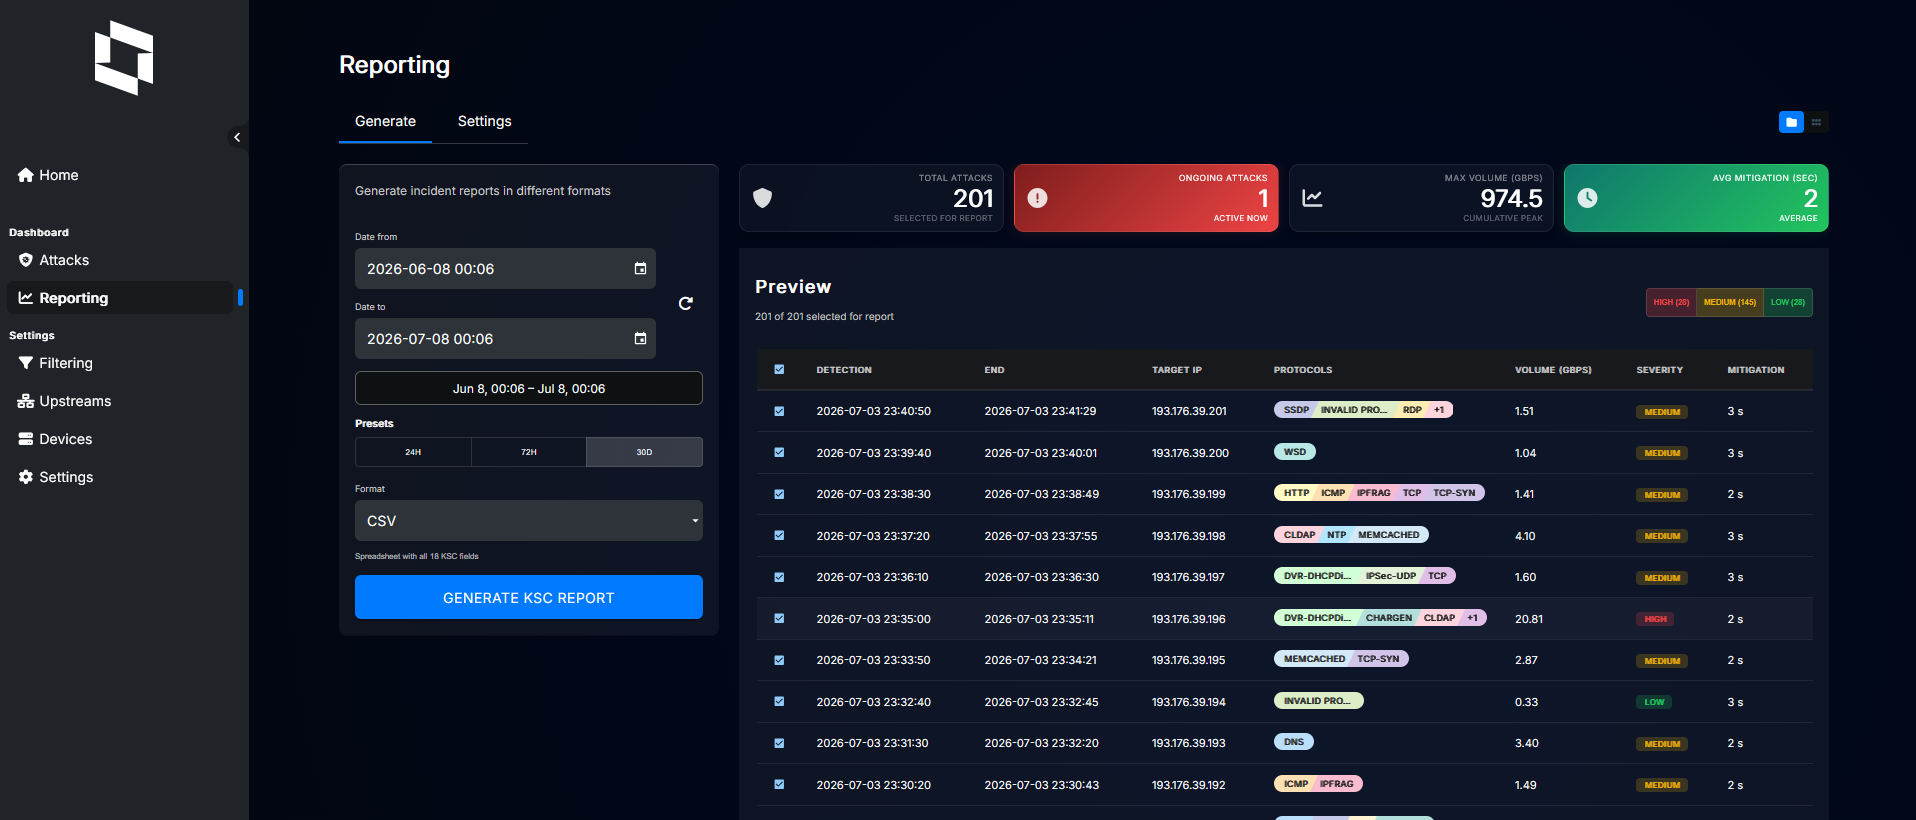
Use Reporting tab thresholds: Enabled by default. Uses the severity thresholds configured under Reporting.
High severity threshold (Gbps): Available when Reporting thresholds are disabled. Attacks at or above this peak rate have High severity.
Medium severity threshold (Gbps): Available when Reporting thresholds are disabled. Attacks at or above this rate and below the High threshold have Medium severity. Lower rates have Low severity. Both thresholds must be positive, and High must be greater than Medium.
Windows: Configure between one and six presets using positive whole numbers of hours or days, up to 365 days per preset. Use Add window to add another preset or the remove action to remove one. Do not repeat the same value and unit.
Click Save. The dashboard refreshes with your settings.
These settings apply only to your account. Custom Executive severity thresholds change how incidents are classified in this dashboard; they do not change detection thresholds, mitigation rules, or Reporting settings.